Container dwell times at Canada’s busiest intermodal hub, the Port of Vancouver, have persisted as a significant issue since the beginning of the year. Canadian Pacific Kansas City (CPKC) has been particularly affected, with over 89,000 feet of containers stuck at Deltaport for more than seven days, according to port data. This is a slight improvement from the peak of nearly 160,000 feet in mid-March, but it still poses a substantial challenge. In contrast, Canadian National (CN) has managed to reduce on-dock footage at all Vancouver terminals in recent weeks.
CN’s response to the surge in container volume at Vancouver has been highly successful, as noted by analyst RailState in FreightWaves. By increasing the number of trains and expanding the average train size, CN has achieved a remarkable 25% increase in daily twenty-foot equivalent unit movement. This has resulted in a consistent decline in on-dock footage and dwell times throughout March.
In comparison to last year, CN’s performance has been impressive:
- – **TEUs per day:** Increased by 11.4% from March 2024 and 25.2% from February.
- – **TEUs per train:** Increased by 9.1% from March 2024 and 15.2% from February.
- – **Trains per day:** Slightly increased by 2.1% from March 2024 and 8.7% from February.
CPKC’s performance, on the other hand, presents a more challenging scenario. Despite a modest 7.6% increase in train volume from February, there has been no significant change in train size. This has proven insufficient to manage the recent influx of containers to Vancouver.
- Year-over-year comparisons reveal a shift in CPKC’s volume, with a notable decrease in daily TEUs per day (down 9.5% from March 2024 but up 8.5% from February). This decline is accompanied by a significant reduction in TEUs per train (down 15% from March 2024 but up 0.9% from February). Conversely, trains per day have shown a positive trend, increasing by 6.4% from March 2024 and 7.6% from February.
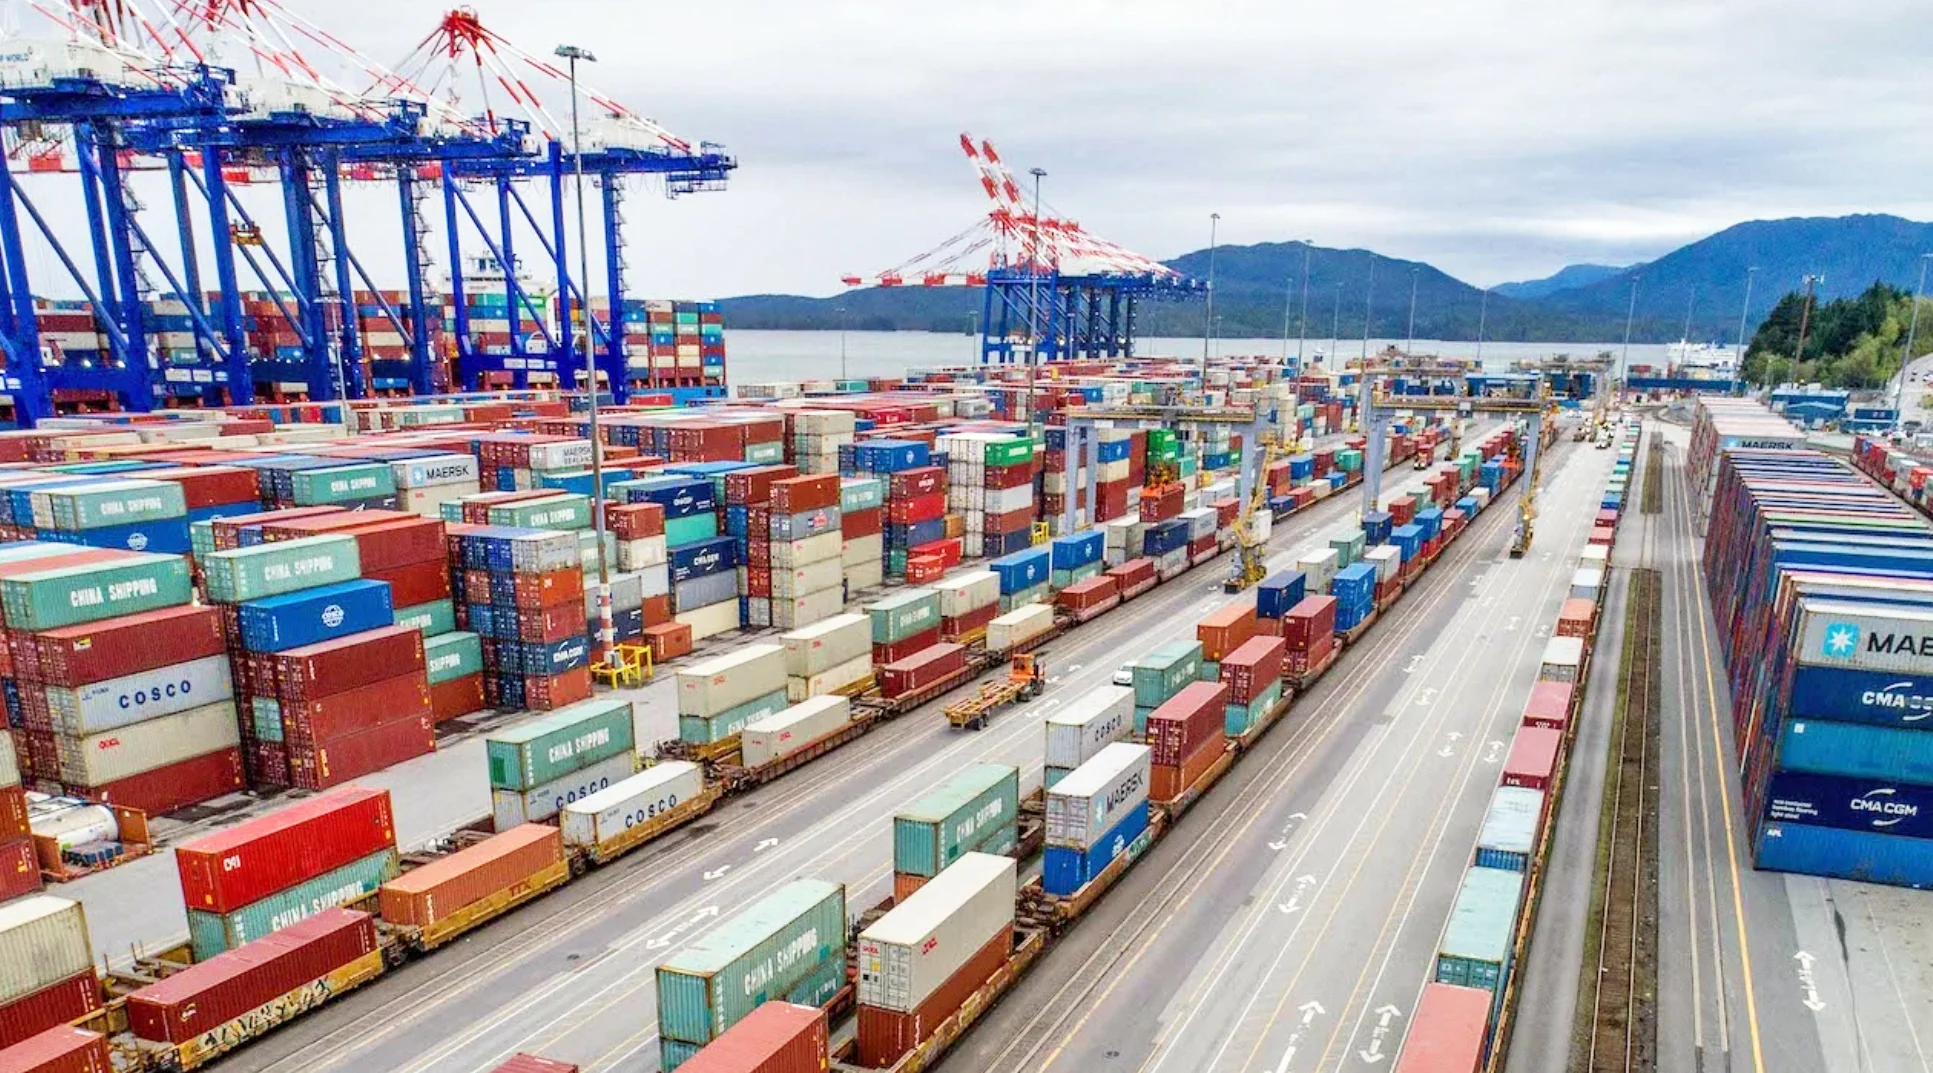
On the other hand, the Port of Prince Rupert has witnessed a dramatic surge in inland traffic. This growth is evident in the substantial increase in the size of trains (up to 529 TEUs per train in March, compared to 425 in February), coupled with an increase in frequency. Consequently, daily volume at the British Columbia port has surged by 71.6% since February.
- In terms of TEUs per day, the Port of Prince Rupert has seen a 7.4% increase from March 2024. TEUs per train have also shown growth, with an 8.3% increase from March 2024 and a remarkable 24.5% increase from February. However, there’s a slight decrease of 0.8% in trains per day from March 2024 and a substantial increase of 37.9% from February.
Halifax, on the other hand, continues to demonstrate steady growth in container volume. Daily TEUs moving inland have reached their highest point in over a year, surpassing last year’s volumes by 32.3%. This growth is primarily attributed to an increase in train volume rather than the introduction of longer trains.
• • Year-over-year comparisons reveal a consistent upward trend in TEUs per day (up 32.3% from March 2024 and 7.9% from February), TEUs per train (up 6.7% from March 2024 and 2.5% from February), and trains per day (up 24% from March 2024 and 5.2% from February).
It’s worth noting that the Port of St. John has experienced increased train volume and sizes, leading to a nearly 50% jump in daily TEU volume moving inland compared to February 2025. However, year-over-year comparisons are limited due to the commencement of RailState data collection in April 2024.